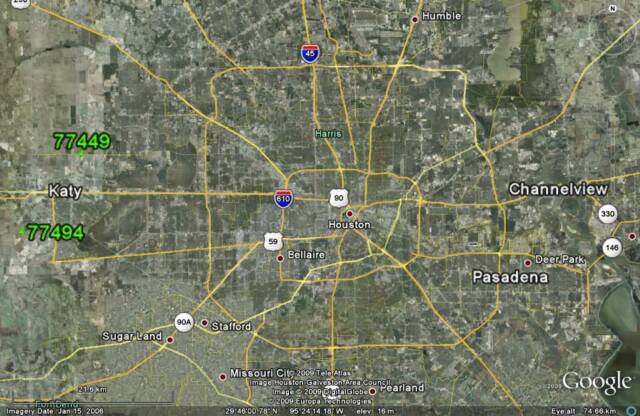
77449
77450
77493
77494
East I-10
77547
77530
East Hwy 225
77502
77503
77504
77505
77506
77536
Katy
Katy
Katy
Katy
Galena Park
Channelview
Pasadena
Pasadena
Pasadena
Pasadena
Pasadena
Deer Park
163%
83%
68%
224%
-33%
44%
41%
45%
33%
35%
13%
31%
41%
29%
24%
29%
-24%
16%
14%
16%
13%
12%
6%
16%
8,575
2,955
1,030
2,451
538
3,874
706
551
530
445
681
418
13%
4%
5%
6%
6%
14%
2%
2%
3%
2%
2%
1%
$69,640
$96,250
$45,526
$74,189
$24,063
$47,604
$24,231
$24,405
$35,357
$31,406
$25,006
$68,182
86%
84%
62%
85%
87%
68%
22%
16%
15%
22%
13%
32%
$146,851
$210,409
$106,603
$218,024
$68,375
$120,278
$92,478
$206,982
$117,159
$208,231
$292,899
$88,110
67,416
68,450
19,894
44,413
9,247
27,508
34,284
24,488
20,469
24,563
37,735
29,964
23
16
11
37
-1
6
1
3
4
11
0
6
%
Black
Growth
00-09
Black
pop
Total
pop
Home
owner
Growth
09-14
Total %
growth
Black
income
Avg home
value
Katy Freeway I-10
WEST & EAST SUBURBS
To the west, the Suburb of Katy and the subdivision of Cinco Ranch have been growing tremendously. More than 14,000 middle class African Americans have participated so far and double digit increases in Black population are expected for the next 5 years. The Katy Independent School District has excellent ratings. Directly east of Houston, Channelview is the only area that has seen a substantial increase in Middle class African Americans.

African Americans make up a small percentage of the overall populations in Houston’s eastern and western suburbs. Continued below....
KEY ZIP CODE LEGEND
YELLOW: More than 10%increase in Black population since 2000, Blacks are more than 17% (median) of the total population, Income $35K and over (median)


GREEN: More than 100% Increase in Black population since 2000 but less than 17% Black, Income $35K and over (median)
 | ||||

MENU
BLACK HOUSTON
MORE HOUSTON
THE SUBURBS
